By: Sam Burch, Twitter (@sburch323), GitHub (@burchsam)
How to define quarterback success is a tricky question. There are traditional statistics like passing yards, touchdowns (TDs), and interceptions (INTs) that are quite interpretable, but can be noisy for smaller sample sizes and depend heavily on dropbacks. Using TD-INT ratio and yards per attempt (YPA) are a step forward, as these rely more on efficiency. Passer rating isn’t bad as well, however there are better, more advanced stats. Adjusted net yards per attempt takes YPA and adjusts for factors like sacks (proven to be largely the QB’s fault), as well as more weight to TDs and INTs. To go even further, expected points added (EPA), was developed. EPA derived from the concept of expected points — first introduced by Vigil Carter in 1970. A model based on game situation, field placement, etc. calculates the expected points for the situation of the team. The change from this play to the next is the expected points added. Many critique this metric because of it’s lack of separation from QB and offensive play as a whole. However, EPA is most predictive of who is winning the game (*Robby*) and all stats are somewhat team based. For example, a QB will have more passing yards if they have better receivers. That’s where PFF grading can come in.
Pro Football Focus grades QBs on every play on a scale of -2 to 2, depending on whether that QB did something good, bad, or neutral. This metric is great at isolating QB play and is fairly stable from year-to-year. However, there are still biases and value being missed from these QBs. For example, ~60% of plays are graded as 0. A QB is always having some impact, positive or negative, on a play. To completely remove that on over half the plays really misses out. Also, I believe sacks aren’t a part of the grading. Thus, while this metric is best for isolating QB play, the actual value of the QB play is being missed.
ESPN’s QBR does a good job as well. This metric predicts the likelihood the QB is actually having a positive impact on a scale from 0 to 100. However, this metric is worse at predicting wins than EPA and is less stable year-to-year than both EPA and PFF grade (*Robby*). Other important metrics of QB play include completion percentage over expected (CPOE) and pressure-to-sack rate (PTSR). The first one is very stable year-to-year, but only measures accuracy. Also, there have been critiques on if it’s best to actually maximize CPOE versus taking more risks. On top of that, there has been discourse on how well we are able to measure accuracy altogether. Lastly, PTSR shows how well a QB is at avoiding sacks given their situation. The elite QBs consistently show up well here and it translates well from college to pro.
With that being said, it was Ben Baldwin who once said “[about] 95% of [how good a QB is can be determined from] looking at EPA (expected points added) and PFF (Pro Football Focus) grade.” Thus, we will look at an EPA/play and PFF grading composite to help determine the best QBs of this era.
I used nflfastR, PFF, and ESPN data since 2006. Each QB has to have at least 400 plays in their career and 150 plays per season to be considered. This will allow us to look at QBs who didn’t play a lot, either because they are young or bad, as well.
By Career
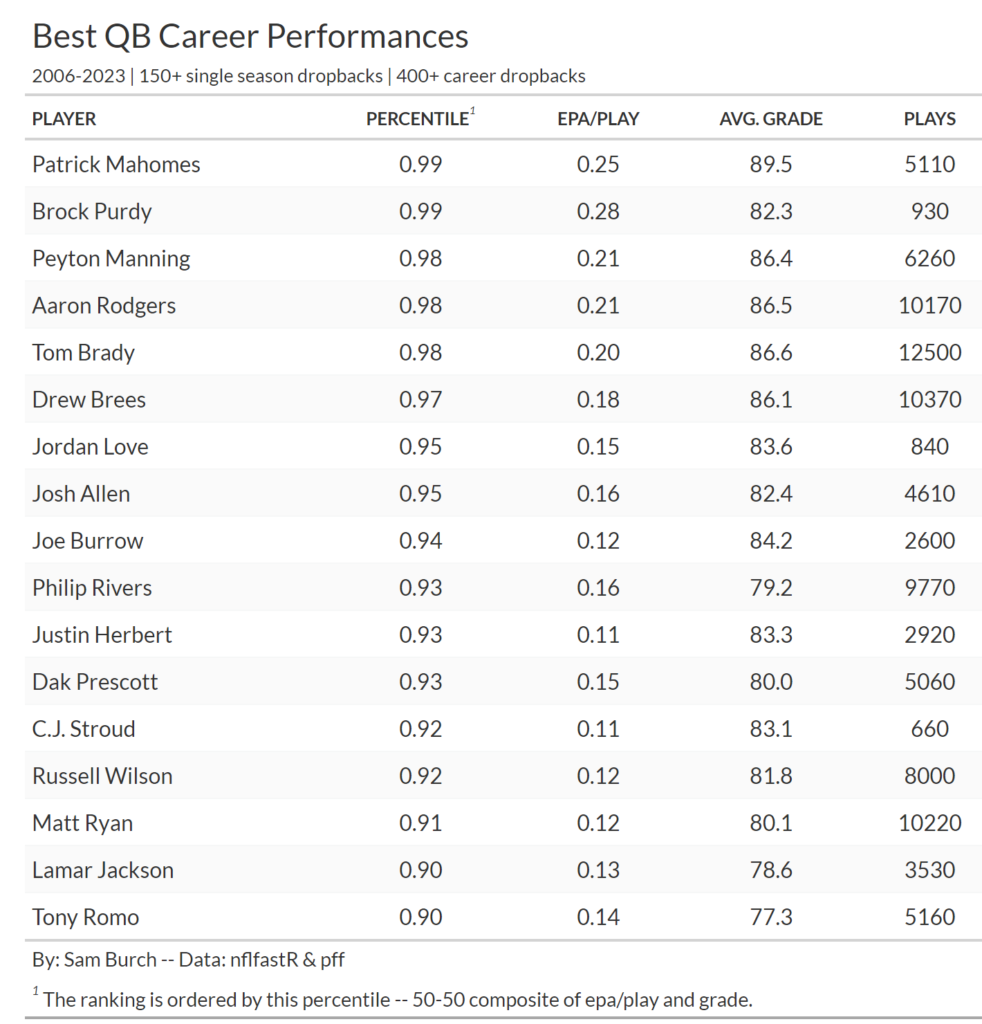
Mahomes is atop here with him having the second best EPA/play and best average grade since 2006. Purdy, boosted by his amazing EPA and short sample size in a great situation, is second. Purdy’s average grade is worse at 11th, but that is still really good. Three historical greats — Manning, Rodgers, and Brady — round out the top five respectively. Each of the three are top five in EPA and grading, with Manning best in EPA (3rd) and Brady best in grading (2nd). Next comes another historical great (Brees) and another small sample guy (Love). Allen, Burrow, and Herbert (modern greats with large enough sample sizes) follow, with Rivers squeezing in between Burrow and Herbert. Allen is top ten in EPA and grading, however Burrow and Herbert are 18th and 19th respectively in EPA.
A couple of QBs who arguably should be lower are Russell Wilson (14th), Jimmy Garoppolo (19th), Deshaun Watson (21st), Tua Tagovailoa (22nd), and Jameis Winston (29th). Russell Wilson has not had a good past two years, but this is based on career play. He’s 16th in EPA/play and 12th in grading over his nearly 8000 career dropbacks; that’s elite play. Jimmy G. is perhaps the original Purdy, although Garoppolo has had fairer criticism. Jimmy G. was benched for rookie A.O.C. this past year and has always been seen as not as great as his production. His EPA is 7th with his grading being 30th. Obviously, that’s a large discrepancy, but (due to the limitations of each metric) he’s likely somewhere in between. Meaning, Garoppolo should be lower, but still higher than public perception. For Watson, I will not be diving into his play (*see references*). Tua has also been seen as someone lifted by their surroundings, however his efficiency and grading are both 22nd. It will be interesting to see how his play progresses after his rookie deal is up, and the team around him is no longer as good. Famous Jameis knows how to take risks, with his efficiency being 24th, despite him 43rd in grading.
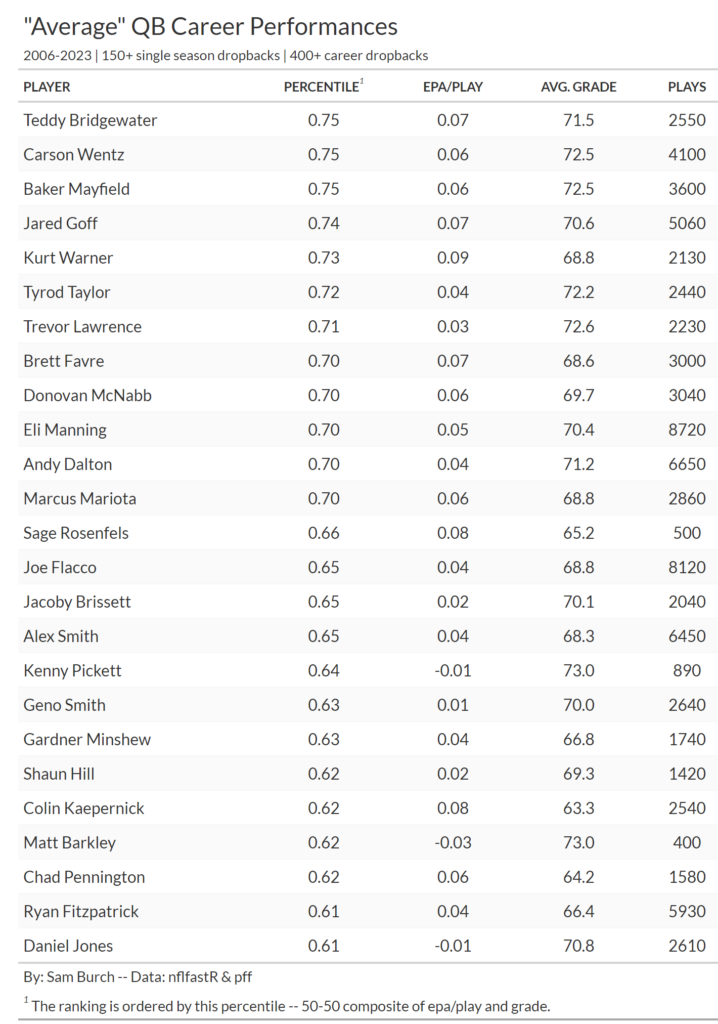
The thought of an average QB would lead to a practical presumption of the 50th percentile here. This is not the case however, because this sample includes perennial backups and busts. This includes players like Mitchell Trubisky (60th percentile), Sam Bradford (54th), Justin Fields (53rd), Brian Hoyer (47th), and Blake Bortles (42nd). When we instead restrict the sample to 1500 career dropbacks, this reduces the sample from 90 to 78, eliminating many unproven players and aforementioned backups and busts. The average is 67th percentile and median is 70th. With this new definition for “average” QB, we can look at the bigger sample and see players like Jared Goff (74th), Eli Manning (70th), Andy Dalton (70th), Joe Flacco (65th), and Geno Smith (63rd). While all are not consistently “average” QBs, this definition certainly makes more sense. Some surprising names in this range include Kurt Warner (73rd) and Trevor Lawrence (71st). Warner’s explanation is that the sample includes data from 2006 on — his last four years. Lawrence had a very rocky rookie season (24th percentile) but bounced back the past two years with 67th and 74th percentile performances respectively. These are not elite numbers because Lawrence has had an issue with consistency, however adjusted EPA numbers (*Ben Baldwin*) show his performance this past year was probably better than this.
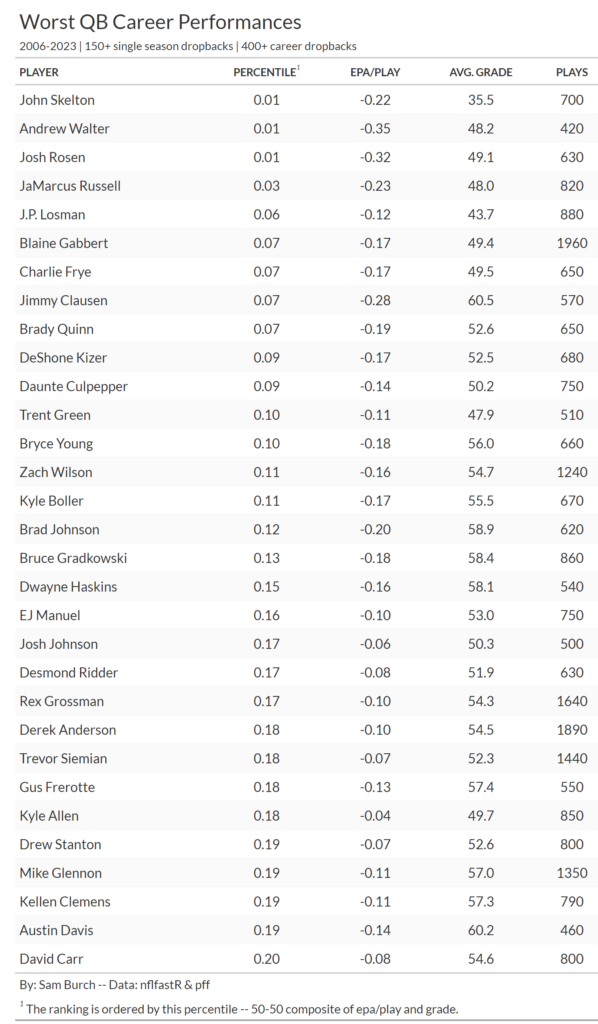
Looking at the worst QBs, we have players like Josh Rosen (1st percentile), Blaine Gabbert (7th), DeShone Kizer (9th), Zach Wilson (11th), and Trevor Siemian (18th). None of these names are likely surprising. Rosen and Kizer each played one awful year. Gabbert’s best year was in 2015 with a 29th percentile performance. One player of note in this range is Bryce Young (10th percentile). Young had a dreadful surrounding cast in his rookie season, but being drafted 1st overall last year suggests he should be given more of a chance. Most of these players didn’t play much at all in the NFL. The average number of seasons (again with the 150 play cutoff) for QBs in the 25th percentile or below is just 2.03, compared to 3.94 for the whole sample. Thus, to not dread on small samples and bad play, let’s move on to the best seasons in this dataset!
By Season
Best QB Seasons Pic

2007 Brady has the best year out of 730. Brady had a 0.38 EPA/play (1st) and 93.9 grade (6th)! This led to an undefeated season, however an unfortunate loss in the Superbowl. (The best teams don’t always win.) Rodgers 2011 and 2020 seasons come next. Rodgers was more efficient during 2011 (2nd vs. 6th) but better grading-wise in 2020 (12th vs. 1st). Next comes Matt Ryan’s MVP season and Mahomes’ first season. Both had elite efficiency and great grading. Drew Brees’ 2018 and 2011 seasons also crack the top ten. Both had top ten grading and top-15 efficiency. Manning squeaks into the top ten with his 2013 season — 16th in efficiency and 11th in grading. Josh McCown’s 2013 season was perhaps the best season in the dataset on a small sample at 12th best. His efficiency was 3rd (!) but boasted the 76th best grade. Jimmy Garoppolo’s first season as a starter, in 2017, gave him the 18th best season; this was again a small sample. Besides these few outliers, along with Lamar’s MVP, Ryan Tannehill’s 2020, and Purdy’s 2023, all of the top 30 seasons are by consensus all-time greats!
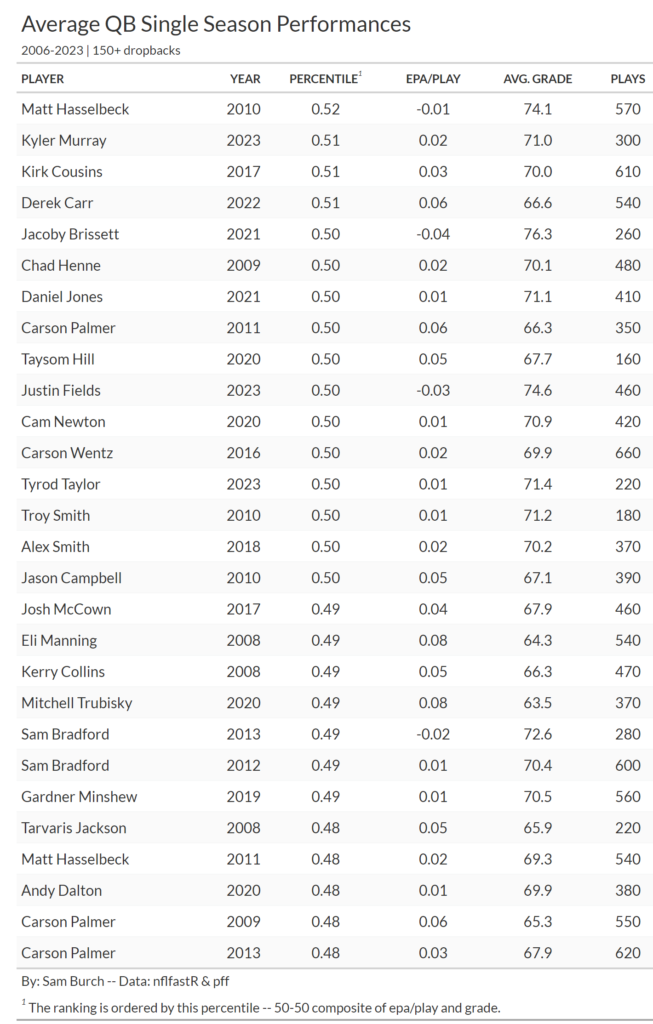
Some average seasons — this time 50th percentile makes sense — include Sam Bradford’s 2015 (54th percentile), Dak Prescott’s 2017 (53rd), Carson Palmer’s 2011 (50th), Alex Smith’s 2018 (50th), Gardner Minshew’s 2019 (49th), Derek Carr’s 2017 (47th), and Justin Fields 2022 (47th). These all make sense as they are either up-and-down seasons or strictly mid. For reference, the average grade for the 45th through 55th percentile is 70. The average efficiency here is 0.03.
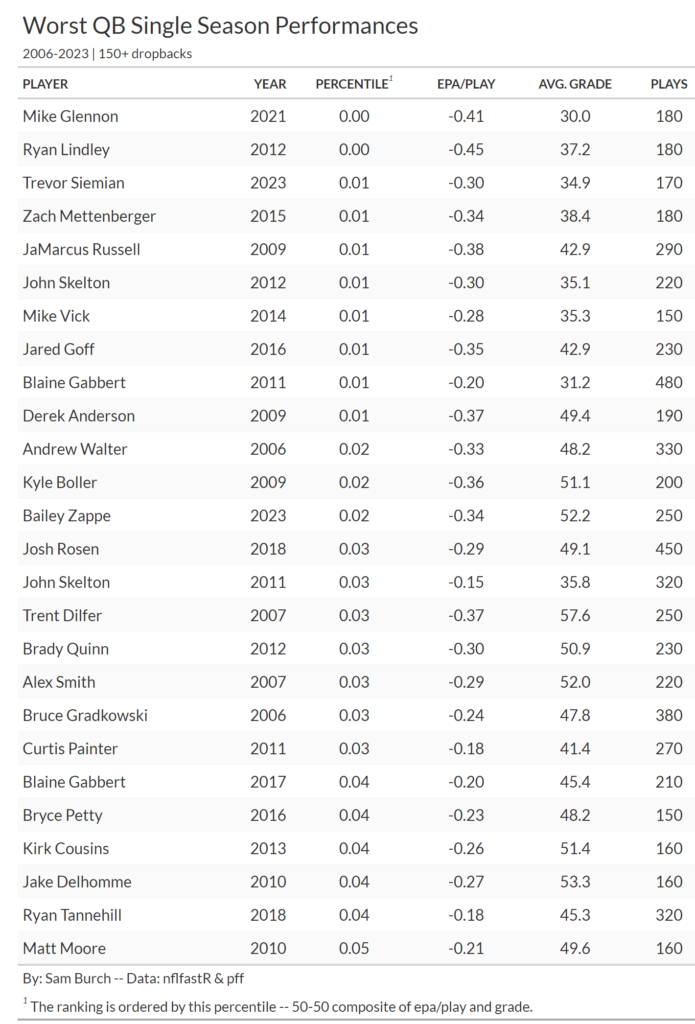
Some bad seasons with decent playing time include Blaine Gabbert’s 2011 (1st percentile), Josh Rosen’s 2018 (3rd), Bruce Gradkowski’s 2006 (3rd), Matthew Stafford’s 2009 (5th), and Mark Sanchez’s 2012 (6th). The average grade for 10th percentile or less is 48.37, and the average efficiency is -0.21. The worst grade in the dataset belongs to Mike Glennon’s 2021 (30), and the worst efficiency belongs to Ryan Lindley’s 2012 (-0.45).
All-Time Greats Comparison
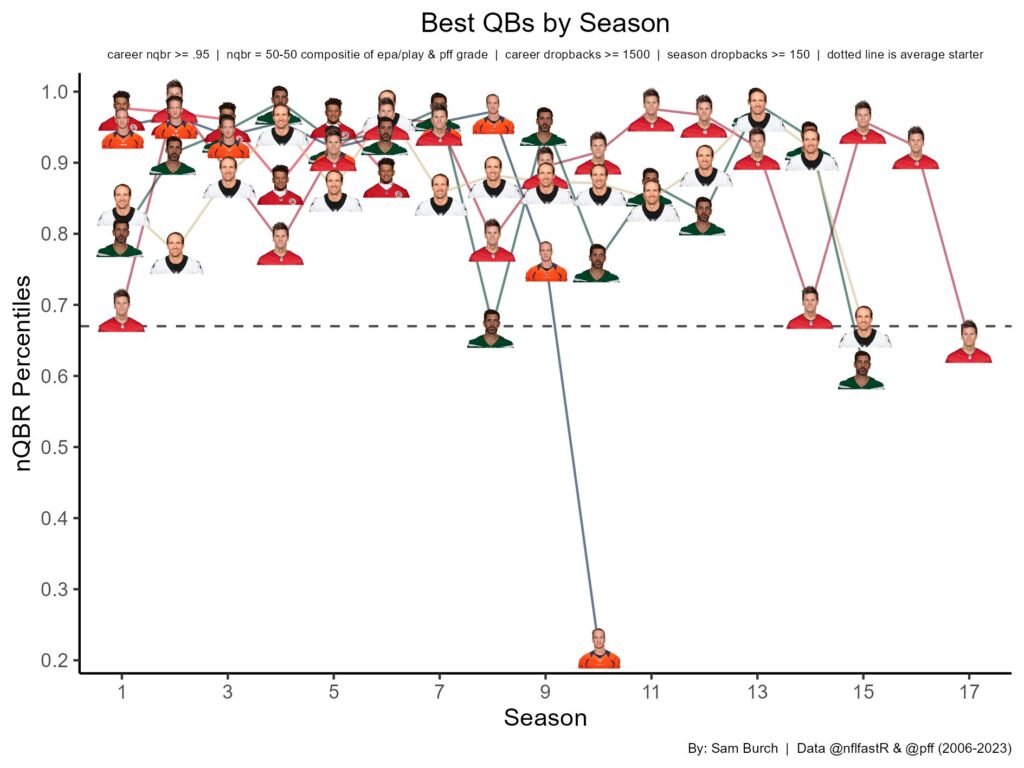
When restricting to at least 1500 dropbacks since 2006, the top-five in the efficiency and grading composite are Mahomes, Manning, Rodgers, Brady, and Brees — respectively. Mahomes has been great on the smallest sample of these five, but he’s been the best. He’s only dipped below the 90th percentile twice, and has still been above the 85th in those seasons! Manning has arguably been the most similar to Mahomes by having elite after elite year, until his last two. In fact, Manning’s 2015 saw him not only dip below average, but to bad; he still won a superbowl that year on the back of a great defense. Rodgers bounces around some more — two seasons below average and four below 80th percentile — however is helped by some of the best seasons in this dataset. Rodgers has the 2nd, 3rd, and 6th best season in this dataset, while no other QB here has more than two — Brady and Brees. Speaking of the consensus GOAT, Brady is hurt by five seasons of worse than 80th percentile play, but he only dropped below average once. Mentioned earlier too, Brady had the best season in this dataset back in 2007. Lastly, while Brees may not be looked upon as elite as some of these players, he is very consistent. Brees fell below 80th percentile only once before his last season and had just four seasons of at least 90th percentile play. Being this consistently elite, along with having two top-ten seasons, brings him into this top-five.
Now, who is actually the best of these five? It is tough to say with this dataset because we restricted the careers of Brees, Brady, and Manning. We do know though that Mahomes has been the best over this span in terms of best EPA (0.25) and best average grade (89.5). Both of these numbers are in their own tier, so it is safe to say Mahomes is on track to be the GOAT. Manning’s numbers would look more similar if he didn’t have that fall off. On top of that, missing value for him and Brady probably puts them in a tier of their own as tied for the current GOAT. In fact, Kevin Cole has an analysis that puts Manning ahead of Brady using more historical data. Rodgers was really good, as mentioned. However, him not having as long of a career puts him just a tier below with Brees. Thus, my personal rankings, based on this analysis, would be the following:
– Mahomes (on track)
– Manning / Brady (Current GOATs)
– Rodgers / Brees (Top-10-OAT)
Heading into 2024
Before we wrap up, let’s look at the QBs heading into next season.
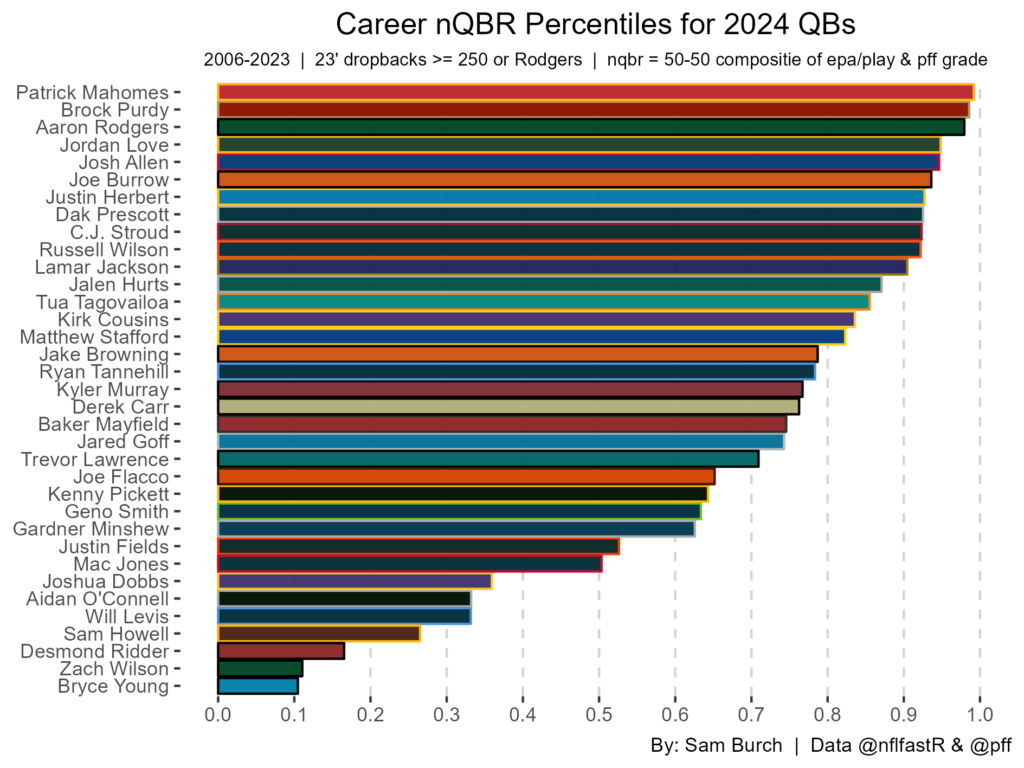
Mahomes is the best QB, duh, but Purdy and Rodgers are interesting. Purdy still has an amazing cast, but perhaps another elite season will put him higher in public perception. Rodgers will have to battle back from not only his worst season two years ago, but also an ACL injury at age 40. Another year of Love and Stroud will show who can stay elite. Russell Wilson and Kirk Cousins (now on different teams) may be able to provide a spark. Will more help around Young and Levis spring them into a sophomore breakout? As a Panthers fan, I’m optimistic about Young, because of his elite college play. For Levis, the better situation should help, but he’s had a problem with sack avoidance ever since college.
What will shake up these rankings a lot next year are the rookies. There are 6 QBs in the top 50 on the consensus board (per Jack Lichtenstein). To add more context to how these college players will perform, I will update my model from last year and project them into the NFL. Stay tuned, and thanks for reading!
References (in order of appearance)
- Vigil Carter [https://pubsonline.informs.org/doi/pdf/10.1287/opre.19.2.541]
- Robby [https://www.nfeloapp.com/analysis/what-are-the-best-metrics-for-nfl-quarterbacks/]
- Ben Baldwin Tweet [https://twitter.com/benbbaldwin/status/1597643184770879488]
- Deshaun Watson [https://www.forbes.com/sites/kimelsesser/2023/08/01/nfl-recognizes-seriousness-of-sexual-coercion-with-new-policy/?sh=4262bcb389b3]
- Ben Baldwin Adjusted EPA [https://x.com/benbbaldwin/status/1757857784735965322?s=20]
- Kevin Cole [https://unexpectedpoints.substack.com/p/the-qb-goat-series-no-1]
- Jack Lichtenstein [https://jacklich10.com/bigboard/nfl/]